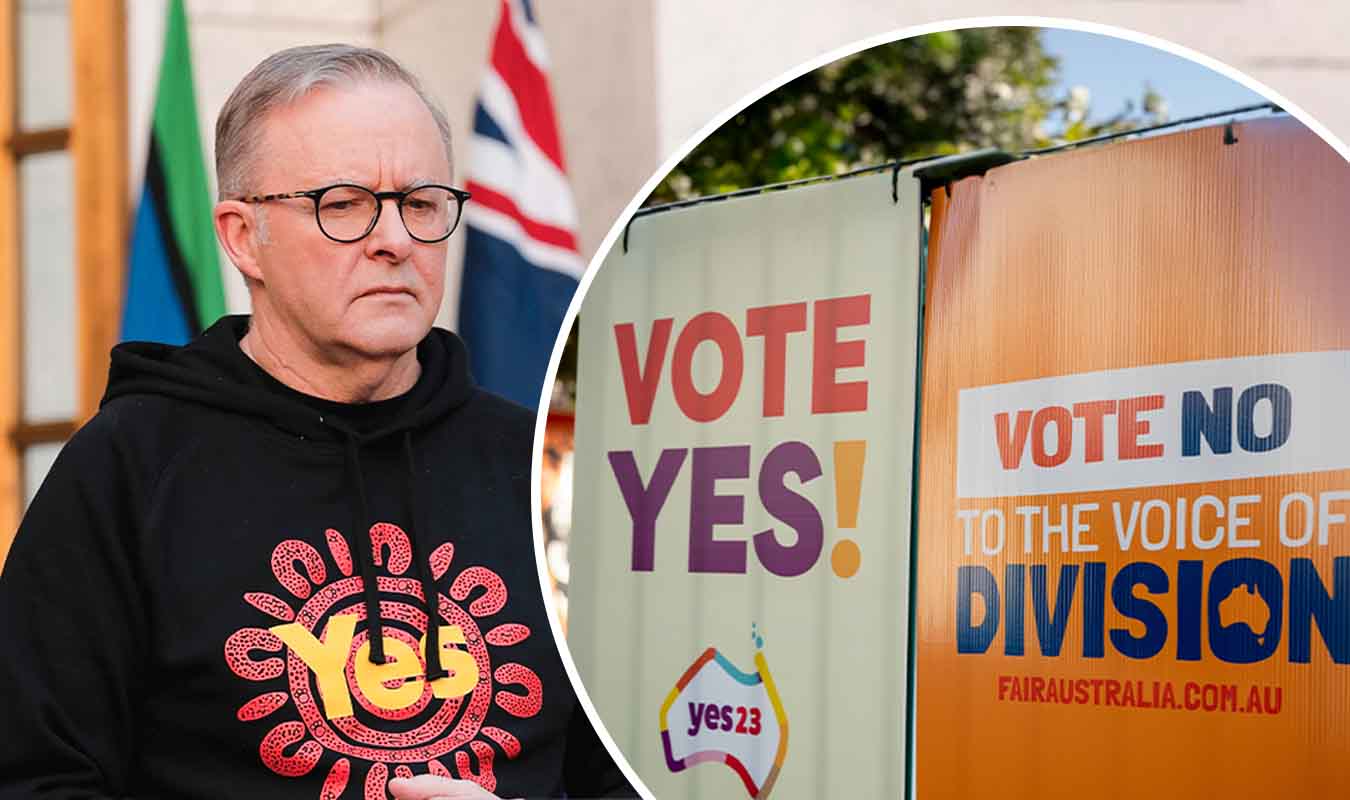
A majority of Tasmania’s 407,000 registered voters have rejected the Indigenous Voice to Parliament.
With 100% of votes now counted from across the state, 59.2% of people voted ‘no’ in the referendum, while 40.8% voted ‘yes’.
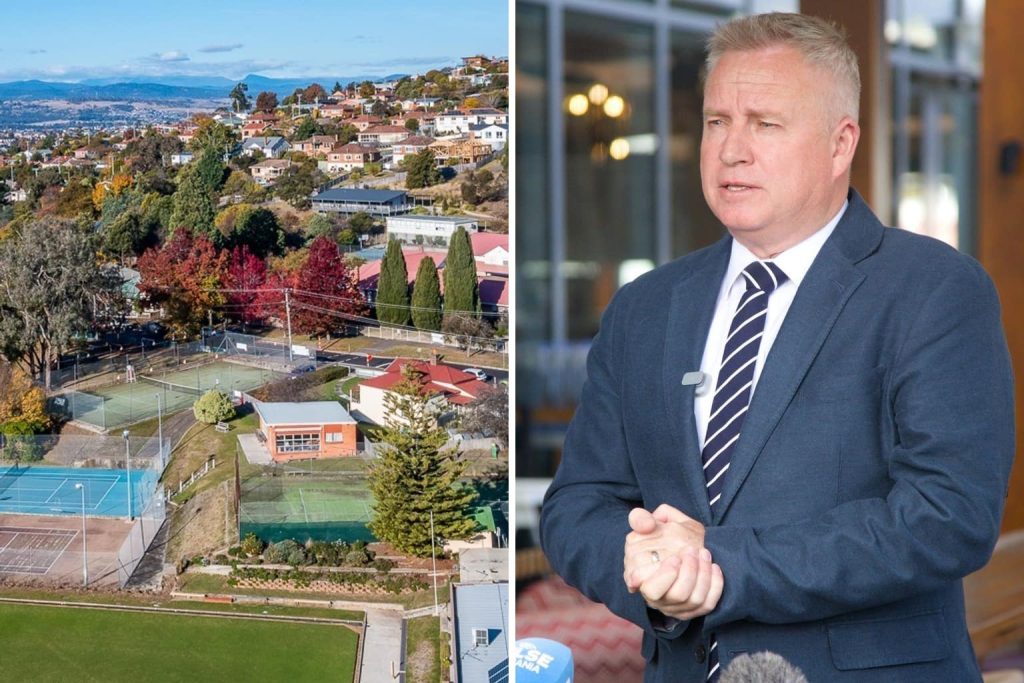
The numbers show a push for ‘yes’ by Tasmania’s Premier Jeremy Rockliff fell on deaf ears in his home electorate of Braddon, which recorded the lowest number of votes in favour of the proposal.
Just 18,567 ‘yes’ votes came in from Rockliff’s West and North-West Coast electorate area, with 49,218 or 72% choosing to vote ‘no’.

The Clark electorate, made up of Hobart and Glenorchy, saw the highest amount of ‘yes’ votes, with 33,318 or 58% of voters backing the voice and 24,097 against it.
The Voice to Parliament referendum has been defeated, with every state excluding the ACT voting no.
FULL VOTES FROM AROUND TASMANIA:
| electorate | Yes | Yes % | No | No % | TOTAL | Enrolled TO VOTE | Did Not Vote |
|---|---|---|---|---|---|---|---|
| BASS: Launceston, Dorset, Flinders, George Town, West Tamar, Flinders Island | 23,403 | 38.42% | 37,509 | 61.58% | 61,590 | 80,020 | 18,430 |
| BRADDON: Burnie, Central Coast, Circular Head, Devonport, King Island, Latrobe, Waratah-Wynard, West Coast | 18,567 | 27.39% | 49,218 | 72.61% | 68,603 | 83,583 | 14,980 |
| CLARK: Glenorchy, Hobart, part of Kingborough | 33,318 | 58.03% | 24,097 | 41.97% | 58,011 | 74,368 | 16,357 |
| FRANKLIN: Huon Valley, part of Clarence, part of Kingborough, Macquarie Island | 32,768 | 50.51% | 32,112 | 49.49% | 65,590 | 81,868 | 16,278 |
| LYONS: Break O’Day, Brighton, Central Highlands, Derwent Valley, Glamorgan-Spring Bay, Kentish, Meander Valley, Northern Midlands, Sorell, Southern Midlands, Tasman, part of Clarence | 21,225 | 32.24% | 44,617 | 67.76% | 66,707 | 87,179 | 20,472 |
Data from the Australian Electoral Commission